If you’re not making minimum wage, you might think you have no skin in the fight over whether it should be raised.
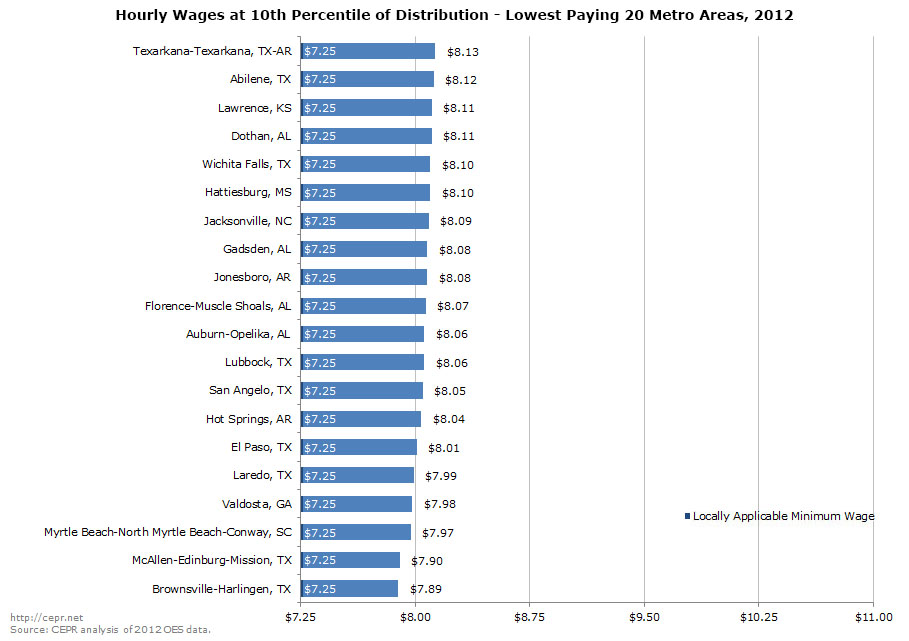
Consider this chart from the Bureau of Labor Statistics in its 2012 Occupational Employment Statistics data. It shows the metropolitan areas with the highest wage rates at the 10th percentile of the wage distribution. (The 10th percentile worker earns more than 10 percent of workers, but less than 90 percent of workers.)

According to the Center for Economic Policy Research, a union-funded think tank, the chart suggests (though doesn’t prove) “a solid correlation between the local minimum wage and the wage rate at the 10th percentile.”
What is interesting in the above data is that the 10th percentile wage figure for all of the above cities consistently exceeds the local minimum wage by $1.00 or more (the only metros where this does not hold are Chicago-Joliet-Naperville and Riverside-San Bernadino-Ontario, which are $0.80 and $0.85 ahead of their local minimum respectively).
We do not find a clustering of the wage distribution at or slightly above the local minimum wage, even in metro areas with relatively high minimum wage levels, such as the DC and Seattle metro areas.
This finding gives anecdotal support for the hypothesis that the minimum wage exerts some degree of upward pressure on local wages, instead of merely serving as a hard floor on the price of labor.
Meanwhile, the organization says, the lowest wages in the 10th percentile are all in states that follow the federal minimum wage exactly.