
Google Maps has been tracking foreclosed houses for sale for a few years now, but more recently has made its application a little more robust as a way to show the pattern of foreclosures in particular neighborhoods.
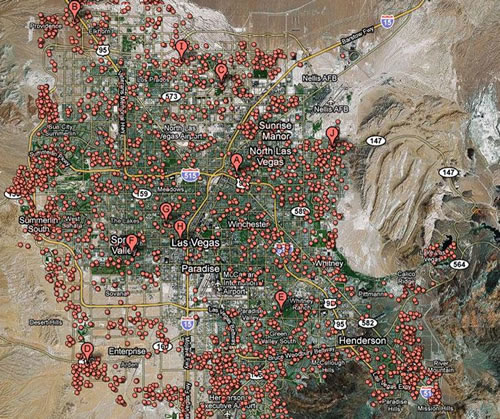
Business Insider just mapped some of the worst cities in America. It’s a great slideshow. Take Las Vegas, for instance:
Let’s take a little tour around our state.
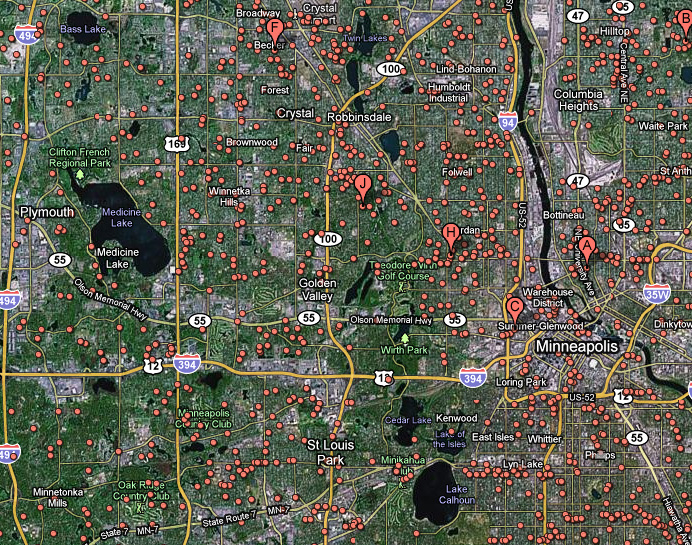
MINNEAPOLIS
Hennepin County foreclosures were up 26% in the 3rd qtr of ’10 compared to ’09
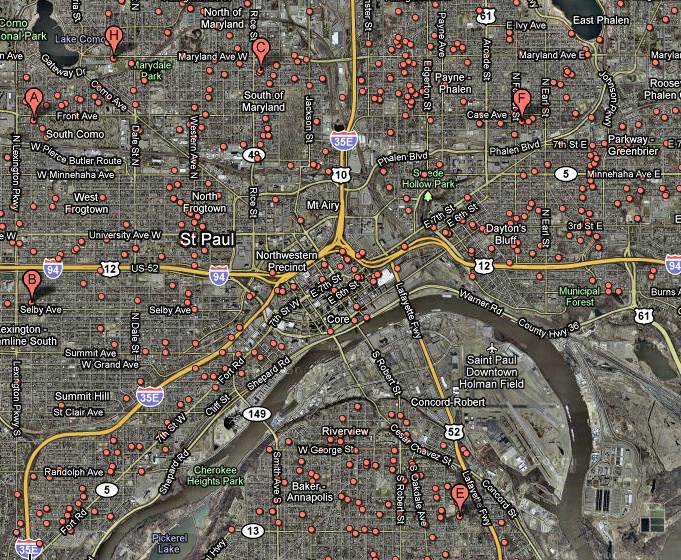
ST. PAUL
Ramsey County foreclosures were up 12% in the 3rd qtr of ’10 compared to ’09
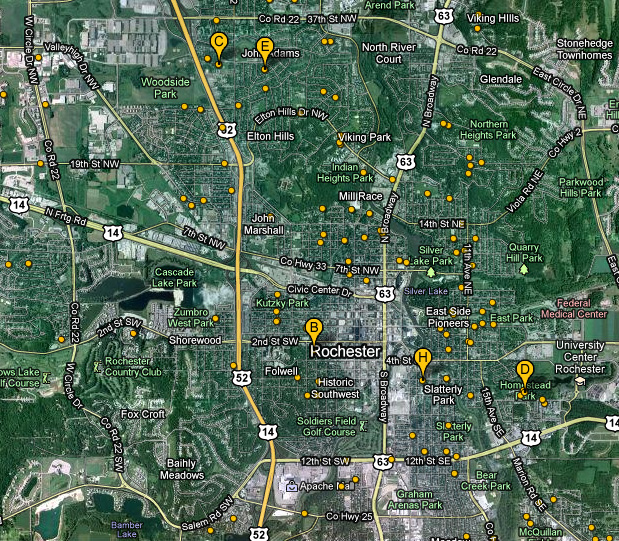
ROCHESTER
Olmstead County foreclosures were up 33% in the 3rd qtr of ’10 compared to ’09
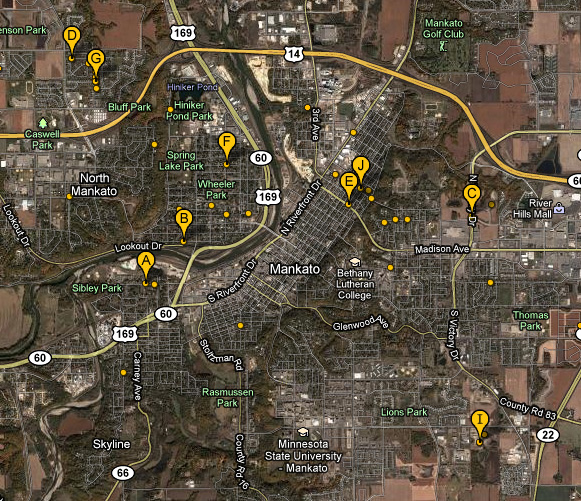
MANKATO
Brown County foreclosures were up 60% in the 3rd qtr of ’10 compared to ’09
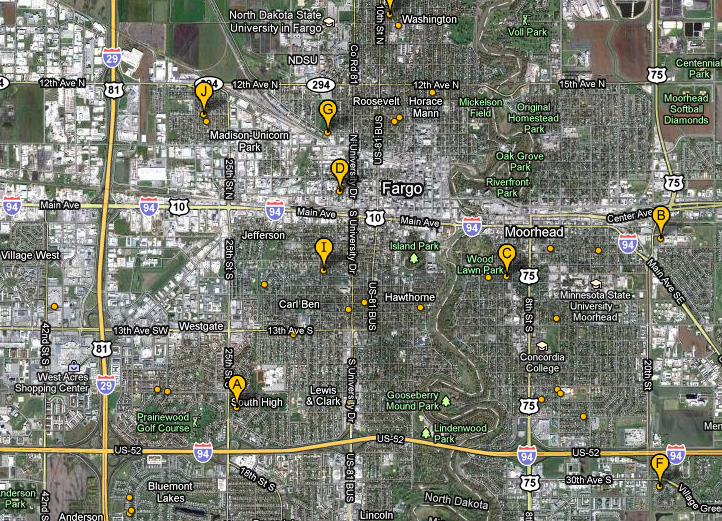
FARGO MOORHEAD
Clay County (Mn) foreclosures were unchanged in the 3rd qtr of ’10 compared to ’09
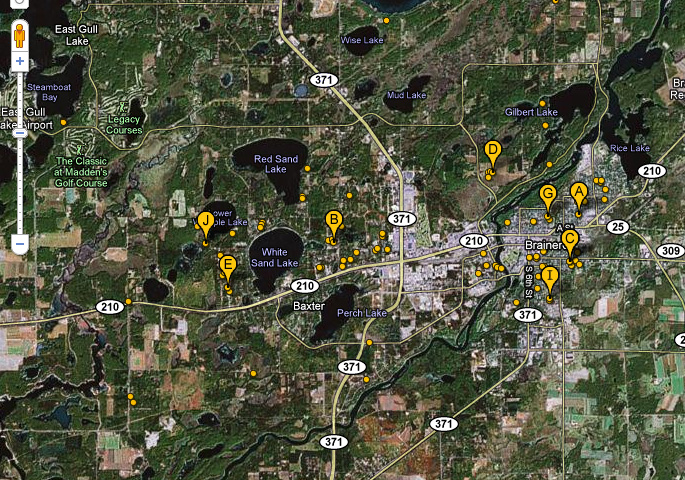
LAKES REGION
Crow Wing County foreclosures were up 15% in the 3rd qtr of ’10 compared to ’09
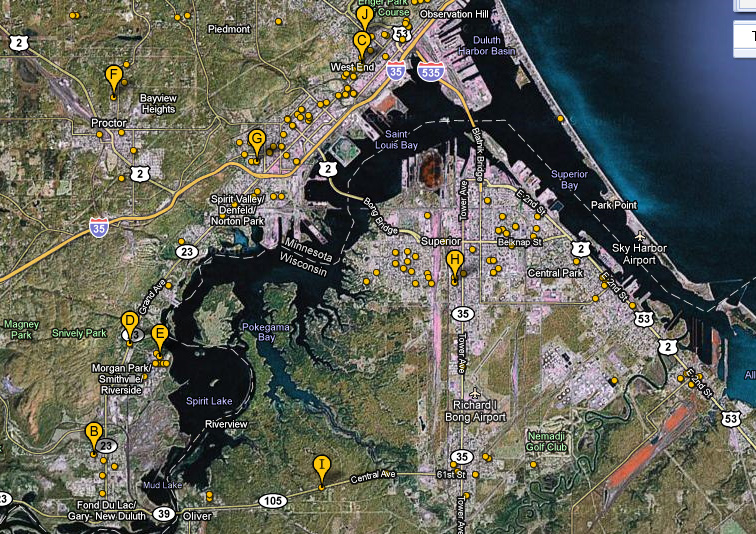
DULUTH
St. Louis County foreclosures were up 36% in the 3rd qtr of ’10 compared to ’09
Want to play with this yourself, just go to Google Maps in your browser…
1. Punch in any US address into Google Maps.
2. Your options are Earth, Satellite, Map, Traffic and . . . More. (Select “More”)
3. The drop down menu gives you a check box option for “Real Estate.”
4. The left column will give you several options (You may have to select “Show Options”)
5. Check the box marked “Foreclosure.”