New MSP “30 year normals” show trends
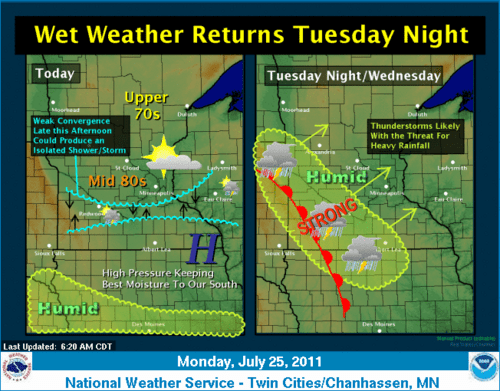
More widespread storms Tuesday night & Wednesday morning.
Enjoy another beautifully dry summer day Tuesday before the next wave of storms moves our way late Tuesday night.
New MSP 30 year climate normals: Some distinct trends
Create a More Connected Minnesota
MPR News is your trusted resource for the news you need. With your support, MPR News brings accessible, courageous journalism and authentic conversation to everyone - free of paywalls and barriers. Your gift makes a difference.
When you hear the weather folks babble about "normal" or more accurately "average" temperatures they are probably talking about a 30 year running average for MSP Airport. (Or another weather station near you)
This month the NWS unveiled the "new" 30 year averages. The data dumps the decade of the 70s (a cold decade) in favor of the 2000's (the hottest decade on record).
The data shows some distinct trends for Minnesota. Some notable data points.
-Winter in Minnesota is getting warmer, especially at night. The average high temperature in January rose 1.8 degrees at MSP Airport. The average January low showed the biggest rise in any month of the year, +3.2 degrees!
-The overall average temperature in January rose 2.5 degrees!
-Summer nights are about 1 degree warmer in the new data set.
-Summer days are about the same, and show no real increase in average high temperature.
-Late summer and fall have trended wetter (about 1") in the past decade.
-Annual precipitation has increased 1.2" for MSP.
-January remains our "snowiest" month of the year on average at 12.1" December has moved into 2nd place at 11.5" replacing March (10.2") which is now in 3rd place.
-Overall winter season snowfall fell nearly 2", from 55.9" to 54" annually.
Climate change theory has long stated that warming should be greatest at northern latitudes. The observed changes in the new set of 30 year averages support this.
In fact, Minnesota & Wisconsin show some of the biggest temperature rises in the USA.
Here's the rest of the story & data from the Twin Cities NWS.
New 1981-2010 Climate Normals
"The National Climatic Data Center (NCDC) is responsible for producing 30 year climate normals of numerous climatological variables every 10 years for U.S. locations. The primary variables include temperature, precipitation, and derived products such as heating and cooling degree days. Normals serve as a baseline average of important climate variables that are used to understand average climate conditions at any location and serve as a consistent point of reference.
In this latest set of normals (1980-2010), the 1971-1980 decade was removed (generally considered a cool decade) and the 2000-2010 decade was added (warmer by comparison). As a result, the 1980-2010 average temperature across the United States is now approximately 0.5 F degrees warmer than the 1971-2000 period. However, this warming is not uniform across the country or from season to season. For instance, the 1981-2010 average high temperature for the mid section of the U.S. is cooler in July compared to the previous set of normals. Meanwhile, the January normal lows are much warmer across the Northern Plains and Upper Mississippi River Valley compared to 1971-2000.
A comparison of how the 1971-2000 (Old) normals compare to the 1981-2010 (New) normals for MSP Airport, & St Cloud. Significant trends highlighted in colored boxes.
(Click to enlarge)
Feeling warmer yet?
PH