
It’s often difficult for those of us in Minnesota to see just how tough the economy is in the United States. This map, released today by the Census Bureau, shows why. The times are comparatively good here.
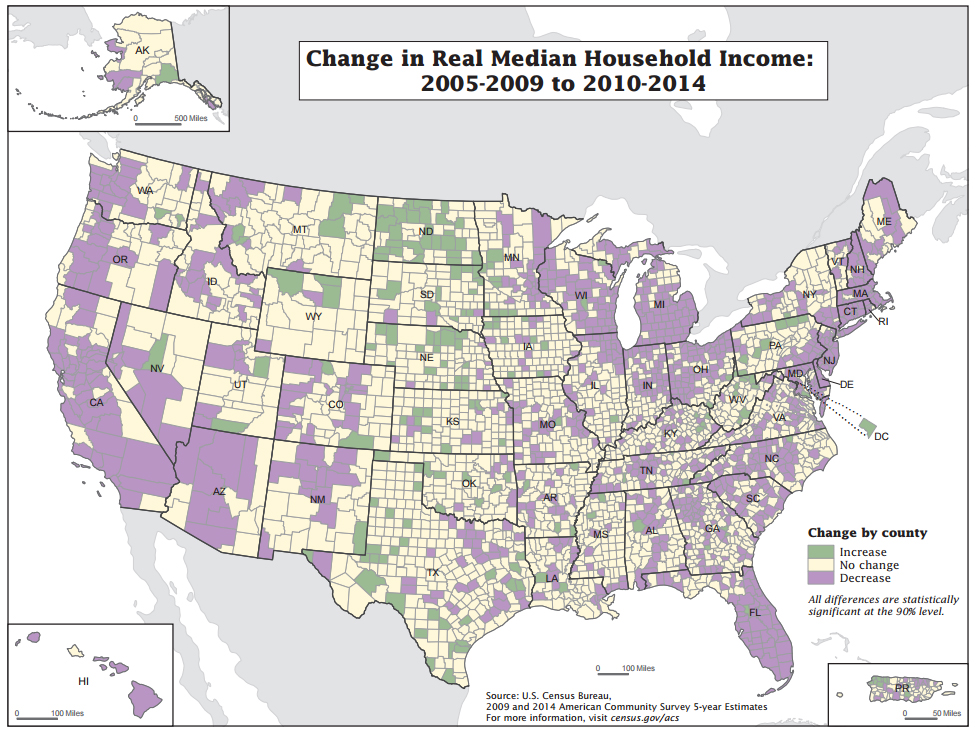
It shows where median household income has declined and, while there’s a slice of Minnesota that documents the drop, there’s also a wave of “prosperity” that snakes down the Midwest to the southern border.
Compare Minnesota, for example, to Wisconsin, where median household income has fallen in 2 out of every 3 counties.
“We’ve taken a definite step downward,” Tim Smeeding, professor of public affairs and economics at the University of Wisconsin-Madison, tells the Milwaukee Journal Sentinel. “Things don’t look good.”
Things don’t look good in lots of places.
Between 2005-2009 and 2010-2014, median household income increased in 187 counties and decreased in 991 counties in the United States, according to the Census Bureau. The change in median income was not statistically significant in 1,964 counties.
Minnesota has its share of woe. Morrison ($48,808 median income) County showed the biggest drop in the five year snapshot that included 2009 to 2014.
But counties on the state’s western border — Grant ($49,632), Swift ($49,752) and Pipestone ($46,800) counties — showed the biggest gains. That’s farm country and that’s significant considering recent news reports have lamented the struggles of farmers in some of those counties over the last year as commodity prices have dropped.
Counties around the Twin Cities (Washington, Hennepin, Ramsey, Chisago) either showed no significant change or a slight drop (Anoka, Dakota, Scott).
Here’s a map of every county.