
Sometimes, the stories about housing values can make you think you should be out on the ledge, even if you don’t feel like jumping. Take the story that was posted this afternoon on the New York Times’ Web site, “Home prices fall for 10th straight month.”
The decline in home prices accelerated and spread to more regions of the country in October, according to a series of private indexes released Wednesday.
Prices fell 6.1 percent from October 2006 in 20 large metropolitan areas, according to Standard & Poor’s/Case-Shiller indexes, compared with a 4.9 percent decline in September. All but three of the 20 regions saw real estate values fall, and even the three places — Seattle, Portland, Ore., and Charlotte, N.C. — where prices were up from a year ago saw prices fall from a month earlier.
The survey meaasures price changes of the same property over time, instead of calculating a median price of homes sold during the month. The guy who runs it described the state of the single family home market as “grim.”
Sounds serious, and I guess it is. But check out the corresponding price of single family housing for Minneapolis since 2000.
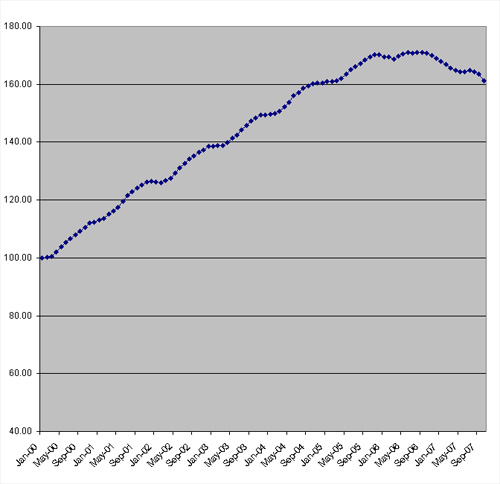
A nine-month slide in prices ended a few months ago with a slight uptick, but then has dropped for three straight months. Still, does that look like a “crisis” to you? The average price is down about 5 percent from its high in September 2006, according to the Standard & Poor’s numbers. The average sale price is down about 4% for the year.
How about this one? It looks like a nearly complete giveback of gains in this decade.
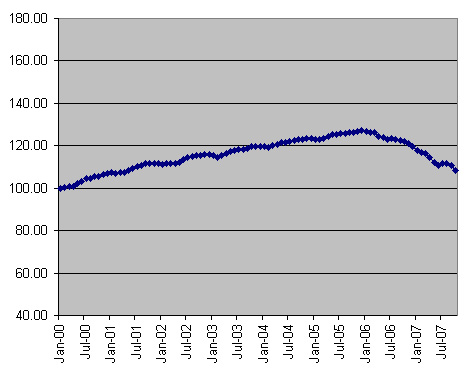
Welcome to Detroit, where home prices have dropped 15 percent from their high in December 2005.
Last week, St. Paul Real Estate, a very interesting blog, crunched the numbers for St. Paul and found sellers of homes in 2007 got slightly less than those who sold in 2006.
The writer, Teresa Boardman, is also way better at making charts.